- sales@hot-mining.com +86 28 8331 1885 +86 15196677188
-

-

-


Grade dilution is a critical consideration in converting geological resources into mineable reserves because it directly affects the grade and tonnage of material delivered to the processing plant, operating costs, and the overall economic value of a mining project.
Explicitly modeling these dilution effects in a block model, rather than applying a generic dilution factor, provides a more reliable foundation for mine design and long-term production scheduling.
Dilution refers to the proportion of non-mineralized material (waste rock) mixed with ore during mining. It is typically expressed as the percentage of waste rock in the total mined material (ore + waste).
On a mass basis, dilution is defined as the ratio of waste rock mass to the total mass of ore and waste. When calculating dilution by volume, the densities of ore and waste rock can be used for conversion.
In block model-based mine planning, it is important to distinguish between the following types of dilution.
Internal dilution refers to waste rock or low-grade material within an orebody that is unavoidably mined together with the ore. Examples include gangue inclusions, low-grade lenses, and internal weak or barren zones.
It also reflects the effects of small-scale geological variability when averaged at the block scale.
Internal dilution is fundamentally a geological and support-related issue.
Geological contact dilution occurs when waste material is included at the boundary between ore and surrounding country rock due to block geometry, minimum mining width, or fixed block dimensions.
In fixed-size block models, boundary blocks may extend partially beyond the actual orebody, making them a source of contact dilution.
External dilution refers to additional waste rock incorporated into the mined material due to operational factors beyond the designed orebody boundaries.
These factors include drilling, blasting, loading, excavation overbreak, blast-induced movement, poor boundary control, and equipment constraints.
Many analytical, empirical, and numerical models focus on estimating external dilution based on operational parameters.
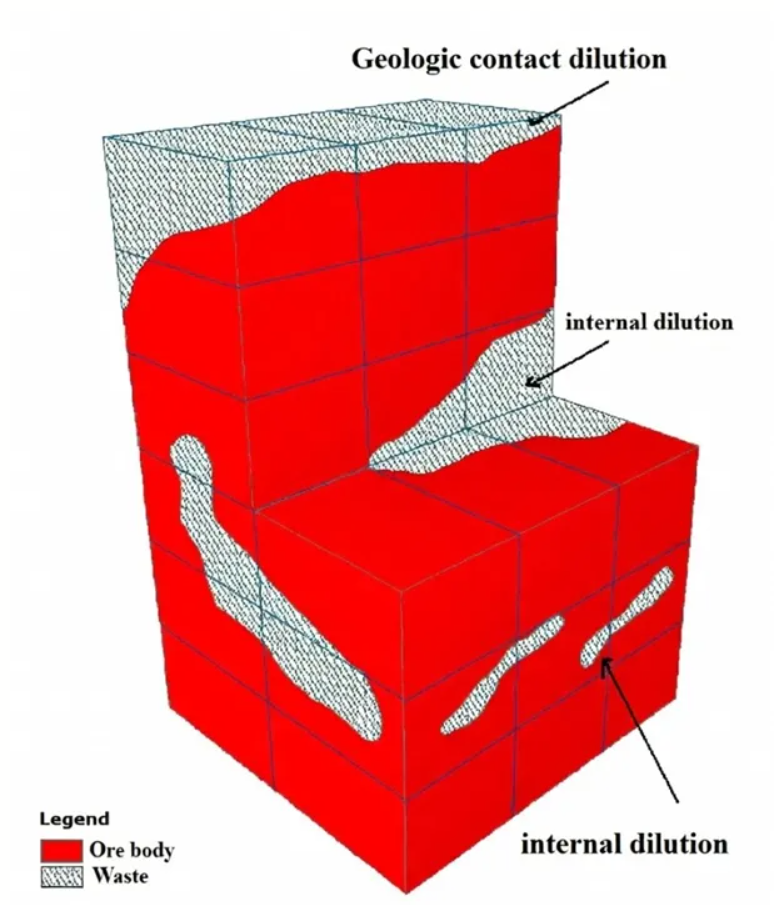
Figure 1. Schematic illustration of different types of grade dilution.
This article focuses on how to quantitatively identify internal and external dilution and simulate their effects in block models, with particular emphasis on methods based on geological and grade data.
Dilution reduces ore grade, increases mined tonnage, may extend the mine life, and generally reduces project net present value (NPV) and return on investment (ROI).
At ore-waste contact zones, dilution may reduce the average grade below the economic cut-off grade, making the material unsuitable for processing.
An increased proportion of waste rock also directly raises mining and processing costs and adds complexity to waste dump management and stockpile inventory control.
Since cut-off grades, pit limits, and production scheduling decisions all depend on block grades and tonnages, a block model that explicitly incorporates dilution provides more realistic long-term production forecasts and better control over feed-grade fluctuations.
Let:
• (m_W) = mass of waste rock
• (m_O) = mass of ore
The dilution ratio ((D)) is defined as:
D = mW / (mW + mO)
When the densities of ore ((\rho_O)) and waste rock ((\rho_W)) are considered, the calculation can be converted to a volumetric basis. This is useful for explicitly tracking volume and density within a block model.
For a single element, let:
• (g_O) = ore grade
• (g_W) = waste rock grade
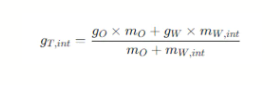
The final grade after internal dilution ((g_T)) can be calculated as:
gT = (gO x mO + gW x mW) /(mO + mW)
This expression can be used to calculate the final internally diluted grade of each block.
If a block consists entirely of ore, its grade remains unchanged after dilution adjustment.
In practice, representative average waste grades and densities can be assumed to calculate (g_T) and (D) for each block.
For example, in an iron ore case study, the assumed Fe and FeO grades of waste rock were 5% and 2%, respectively. The waste rock density was 2.65 g/cm³, while the ore density was 4 g/cm³ (Masoumi, Kamali, and Asghari, 2019).
Internal dilution occurs when a block contains a mixture of ore and waste rock or exhibits significant variations in ore grade.
This may result from several geological conditions:
• Thin waste or gangue bands embedded within the orebody.
• Low-grade veins or lenses.
• Geological variability occurring at a scale smaller than the block dimensions.
• Fixed and relatively large block dimensions that cross actual geological boundaries.
Fixed-size geological block models may cause blocks near orebody margins to extend beyond the actual mineralized boundaries, automatically increasing the dilution ratio of these boundary blocks.
A study conducted on the Gohar Zamin iron ore deposit demonstrates an integrated approach to quantifying internal dilution block by block and adjusting the corresponding ore grades.
The workflow consists of the following steps.
Drill-hole samples are composited at appropriate intervals, such as 2 m, and coded as ore or waste based on detailed lithological descriptions (Masoumi, Kamali, and Asghari, 2019).
Assay data for key elements, such as Fe, FeO, P, and S, are composited at suitable lengths, such as 6 m, for subsequent grade simulation.
An initial geological model is constructed based on the first and last occurrences of ore in each drill hole, thereby defining the spatial domain for internal dilution simulation (Masoumi, Kamali, and Asghari, 2019).
A regular block model with fixed block dimensions, such as 10 × 10 × 15 m, is then established within this domain.
Lithology is treated as a categorical variable, with ore and waste represented as separate categories.
Sequential Indicator Simulation (SIS) is used to simulate lithological distribution, with indicator variograms capturing anisotropy and spatial continuity (Masoumi, Kamali, and Asghari, 2019).
Multiple realizations are generated, for example, 100 simulations. The E-type (mean) probability of ore occurrence for each block is then calculated from these realizations.
The resulting E-type probability map reveals spatial distribution patterns, such as lower probabilities of ore occurrence near orebody boundaries.
For each block, the proportions of ore and waste are calculated based on ore occurrence probability, density, and total block volume.
The internal dilution ratio, (D), is then estimated using a volume-density relationship.
Blocks with high dilution ratios generally correspond to areas containing thick waste layers or blocks that are partially located outside the orebody.
These high-dilution blocks can be identified and mapped to highlight problematic areas. For example, blocks with dilution ratios exceeding 50% can be highlighted in blue.
Continuous grade variables, including Fe, FeO, P, and S, are jointly simulated using the Minimum/Maximum Autocorrelation Factors (MAF) method.
First, the variables are transformed into Gaussian scores, and a covariance matrix is calculated. Eigenvalue decomposition is then performed to obtain the principal components, which are subsequently rotated into spatially decorrelated MAF factors (Masoumi, Kamali, and Asghari, 2019).
Each MAF factor has approximately zero mean and unit variance. Cross-variograms are used to verify spatial decorrelation between the factors.
The factors are then simulated independently, for example, using Sequential Gaussian Simulation (SGS). Back-transformation is subsequently performed to recover the original correlated grade variables, allowing the original relationships between the grades to be reproduced.
For each block, the internal dilution proportion is combined with the simulated ore grade, assuming that the waste rock grade is known.
The final Fe and FeO grades are calculated using the mixing formula described above (Masoumi, Kamali, and Asghari, 2019).
In areas with very low ore occurrence probabilities, such as 10%, the resulting Fe and FeO grades may fall to levels at which the block should be classified as waste rather than ore.
Conversely, where thin internal waste layers are present, moderate internal dilution may reduce the Fe grade from 62.2% to 58.95%.
When applied to the northern section of the Gohar Zamin iron ore deposit, the integrated SIS–MAF method estimated an average internal dilution of approximately 10% across all simulated blocks (Masoumi, Kamali, and Asghari, 2019).
Although this figure is slightly higher than the mine-wide internal dilution assumption of 7.5–8%, the method provides specific dilution estimates and adjusted grades for individual blocks.
On average, accounting for internal dilution resulted in an approximately 10% reduction in Fe and FeO grades compared with simulation results that ignored dilution (Masoumi, Kamali, and Asghari, 2019).
Many blocks with dilution ratios exceeding 50% were located in areas containing thick waste layers. This information can help guide selective mining strategies or adjustments to mine design.
Importantly, the internal dilution estimates generated by this method showed strong agreement with lithological measurements from drill-and-blast holes.
For example, one blast-hole layout recorded 612 m of ore and 137 m of waste within the mineralized area, corresponding to a dilution ratio of approximately 11%. This was very close to the simulation result of approximately 10% (Masoumi, Kamali, and Asghari, 2019).
This validation supports the use of the method in long-term mine planning.
The Gohar Zamin study primarily addresses internal dilution, which is controlled by geological factors.
External dilution, by contrast, involves additional operational or engineering factors, including:
• Excavation beyond orebody boundaries in open-pit mines due to equipment geometry or operational errors.
• Overbreak during underground blasting, resulting in the inclusion of hanging-wall or footwall rock.
• Movement and mixing of ore and waste caused by blasting before loading.
• Minimum mining width requirements or safety factors that necessitate the extraction of waste rock near ore-waste contacts.
Although many previous models have focused on these operational factors, they have generally failed to incorporate detailed geological and lithological data into dilution estimation.
When constructing a block model, the following practical distinction can be applied.
Internal / Geological Dilution
Internal dilution can be predicted using the SIS + MAF approach described above. It represents the mixing of ore and waste within the geological orebody.
Contact and Operational (External) Dilution
Contact and operational dilution can be estimated using geometric proximity analysis between ore and waste, blast movement models, or empirical relationships.
These effects can then be incorporated as additional correction factors or stored as separate block model attributes.
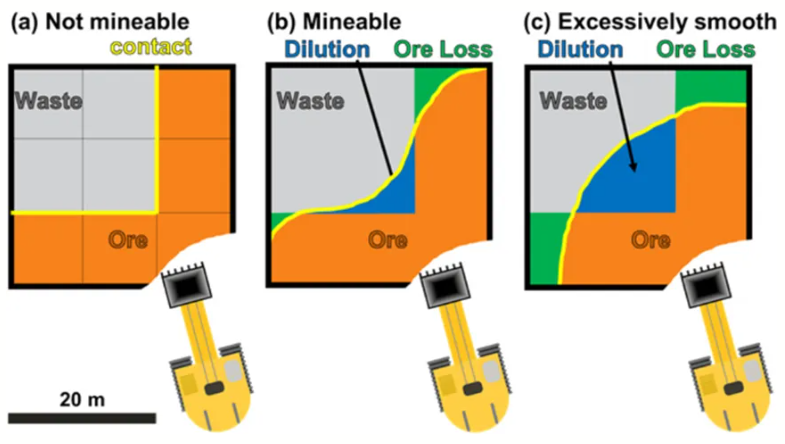
Figure 2. Comparison of dilution, ore loss, and profitability under different manually defined excavation limits and optimized ore-waste boundaries.
A dilution-aware block model can store the following attributes:
• Undiluted grade estimates (geological resource grade).
• Internal dilution percentage for each block ((D_{int})).
• Internally diluted grade ((g_{T,int})).
• Optional external dilution attributes for each mining unit or boundary block ((D_{ext})).
• Fully diluted grade incorporating both internal and external dilution ((g_{T,full})).
This structure allows undiluted grades to be used in geological reporting, while diluted grades can be applied to pit optimization, reserve estimation, and production scheduling.
The Gohar Zamin method effectively populates (D_{int}) and (g_{T,int}) at the block scale (Masoumi, Kamali, and Asghari, 2019).
The block model can distinguish the following variables:
• Undiluted grade (geological resource):
• Internal dilution percentage:

• Internally diluted grade:
• External dilution percentage (optional):
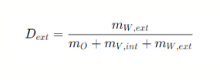
• Fully diluted grade (internal + external):
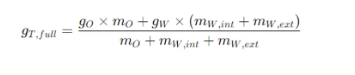
These attributes provide a consistent framework for tracking dilution throughout resource estimation and mine planning.
The fixed grid dimensions used in the Gohar Zamin study (10 × 10 × 15 m) mean that some blocks near deposit boundaries inevitably cross ore-waste contacts, contributing significantly to internal and contact dilution.
Mapping these high-dilution blocks can help identify opportunities to improve mine design by reducing geological and external dilution through smaller block dimensions or the introduction of sub-blocking.
The study explicitly indicates that boundary-block dilution increases significantly as a result of fixed block dimensions.
More broadly, careful selection of the Selective Mining Unit (SMU) size, guided by support-effect analysis and economic criteria, helps balance grade smoothing (internal dilution) against operational selectivity.
In narrow orebodies or deposits dominated by complex boundaries, smaller blocks or variable-sized block models may reduce both internal and external dilution, although they also increase computational complexity.
Robust dilution modeling must be validated against actual operational data.
The simulated average internal dilution of approximately 10% is consistent with the mine's operational assumption of 7.5–8%.
The slightly higher estimate is attributable to the fact that dilution is calculated independently for individual blocks and its effects are propagated through the grade calculations.
For each bench layout, the empirical dilution ratio can be calculated from the ore and waste lengths recorded in blast-hole lithological logs.
For example:
612 m of ore versus 137 m of waste corresponds to approximately 11% dilution (Masoumi, Kamali, and Asghari, 2019).
This empirical result can then be compared with the modeled dilution of the corresponding blocks. The study reports a high degree of agreement between the two.
Blocks with low modeled ore occurrence probabilities (less than 25%) generally correspond to areas recorded as waste in blast-hole lithological logs.
This indicates consistency in the internal dilution predictions.
Minor discrepancies may be attributed to differences in data resolution (2 m compositing versus actual geological variability) and the spacing between exploration drill holes and blast holes (Masoumi, Kamali, and Asghari, 2019).
Continuous validation of modeled dilution against actual measurements supports the iterative refinement of internal and external dilution models throughout the mine life cycle.
Based on the case study and broader geostatistical principles, the following framework provides a practical approach to modeling internal and external dilution in block models.
Determine whether the block model is intended to represent undiluted geological resources, mineable ore, or plant feed.
Alternatively, these three stages can be represented using separate attributes within the same model.
This decision determines the extent to which dilution should be incorporated into the block model.
Code ore and waste categories using high-resolution lithological logging data.
Apply SIS to simulate lithology and estimate the probability of ore and waste occurrence in each block.
Combine these probabilities with density differences to calculate internal dilution as the proportion of waste in each block.
Use multivariate methods such as MAF to jointly simulate grade variables, preserve cross-correlations, and obtain final diluted grades.
Analyze blocks along ore-waste boundaries to identify internal and contact dilution caused by block geometry.
Incorporate operational constraints, including excavation limits, stope outlines, and safety margins, to quantify additional waste material and distinguish external dilution from geological dilution.
Generate grade-tonnage and contained metal tonnage curves at different support sizes to understand how internal dilution changes with block dimensions or SMU size.
Use the results to optimize block model design.
Compare modeled dilution with blast-hole lithological records, grade control data, and mine-to-mill reconciliation results.
Where necessary, adjust assumptions regarding waste rock grades, densities, and ore occurrence probabilities.
Use diluted grades and tonnages for pit optimization and production scheduling, while retaining the undiluted model for mineral resource reporting.
Quantify the impact of dilution on NPV, cut-off grade selection, and plant feed variability.
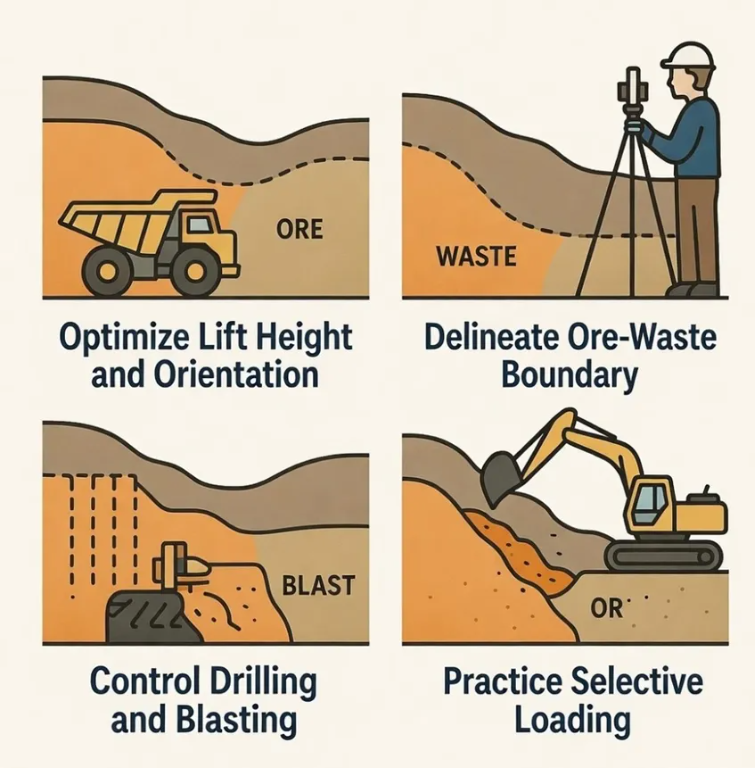
Figure 3. Methods for minimizing dilution and ore loss during mining operations.